Shapes to Sound
This blog post is still a work in progress, hehe.
Introduction
Back in 2022, I finished up my master’s degree and completed my dissertation project looking at the relationship between shape and sound. This was a side project to larger work being undertaken by Sebastian Löbbers - you can find his research here.
As part of my work, I used data collected by Sebastian to train a multi-class classifier to classify six categories of shapes to a corresponding sound descriptor and I was pretty happy with how the final results came out. Below is a confusion matrix showing the ground truth labelling against the predicted labelling.
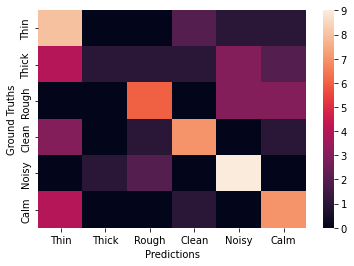
Ok, so the confusion matrix looks a little bit messy - but you’ll understand my reasoning for being happy with these results after I’ve explained my thinking.
The Data
As I was using data collected from a small study, there wasn’t much of it. BUT luckily, the sketches collected were stored in the same format of those in the Quick, Draw! dataset by Google - so I could make use of the machine learning technique transfer learning.
I selected six categories from the dataset that represented abstract shapes, these ended up being: circle, line, square, squiggle, tornado and zig-zag. These categories had a lot more samples that the Sketching Sounds dataset (2500 per category vs 62 per catgeory) and could be used to pretrain the classification network. After this round of training, part of the network was frozen and the smaller training dataset was run through. To help a little bit, data augmentation was applied via a random scaling of sketches for both datasets.
The smaller dataset also consisted of six categories, but the labels were a bit more abstract. The six categories were thick, thin, rough, noisy, clean and calm. During the data collection, participants were asked to draw shapes they associated with these descriptors and so, we have an abstract shape-sound dataset!
The Network
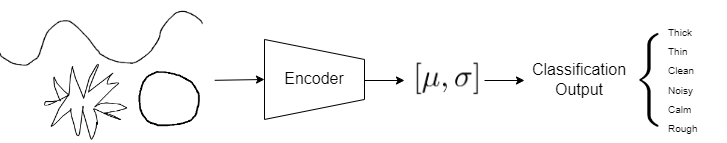
The network is comprised of an LSTM-based encoder followed by two dense layers to a six-way classification output. The inspiration for the network architecture came from Sketch-RNN which, similarly, uses a bidirection LSTM encoder, but also has a decoder to generate new sketches. Since I was not looking to generate images, I scrapped the decoder and instead followed a usual classification structure after the encoder using softmax at the end. I’ve provided a lame diagram of the complete network below for some understanding, but also to keep this post looking nice.
The Results!
Ok, so now I can explain why I’m happy with the messy confusion matrix at the top of the page. The Sketching Sounds dataset is fairly abstract and in this project I was looking to explore whether or not there was consistency between the shapes and sounds descriptors. Also, there wasn’t too much data to work with, so training the network to generalise was tricky at times. Saying that though, four of the six categories had a classification accuracy of 67% or above, one had 58% and the final category was a bit all over the place. So, five out of six categories performing above chance is nice to see! However, it would’ve been good to have some more data as the final test set only had 12 sketches per category… hmm.
It terms of how well the network was trained, I’ve provided the confusion matrix for classification on the Quick, Draw! trained network alongside the confusion matrix for the Sketching Sounds trained network. Pre-training on the larger dataset helped speed things up and also helped increase the final output accuracy. The network associated with the Quick, Draw! dataset is on the left and the Sketching Sounds one on the right.
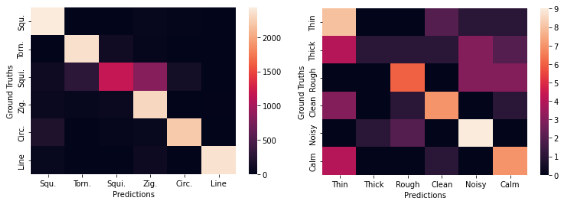
Not having to continuously train the encoder also saved on a bit of energy!